Time Trends of Tuberculosis in Singapore (1995-2011)
Some of the local press (courtesy of the Saw Swee Hock School of Public Health‘s corporate communications team) picked up an obscure article that we published earlier this year in BMC Public Health, looking at the trend of tuberculosis in Singapore (among residents and non-residents) between 1995 and 2011.
Here’s the Today link.
Basically, we looked at all culture-positive TB cases that were notified to the STEP registry in Singapore between 1995 and 2011, plotted these on a chart, and tried to find broad associations using available demographic data from the Department of Statistics. Overall, the incidence of TB had dropped dramatically between 1995 and 2007, but started to rise again between 2008 and 2011. This did not correlate with the country’s GDP or HIV rates, but there was a remarkable association with the ageing population (Figure below – courtesy of Dr Alex Cook from SSHSPH) among the Singapore residents (our official euphemism for both Singapore citizens and permanent residents).

TB incidence by age band in Singapore – apparent rise among the elderly (chart by Dr Alex Cook of SSHSPH)
Was there really a rise in TB incidence among the elderly over time? Well, the following chart by Alex Cook showed otherwise.
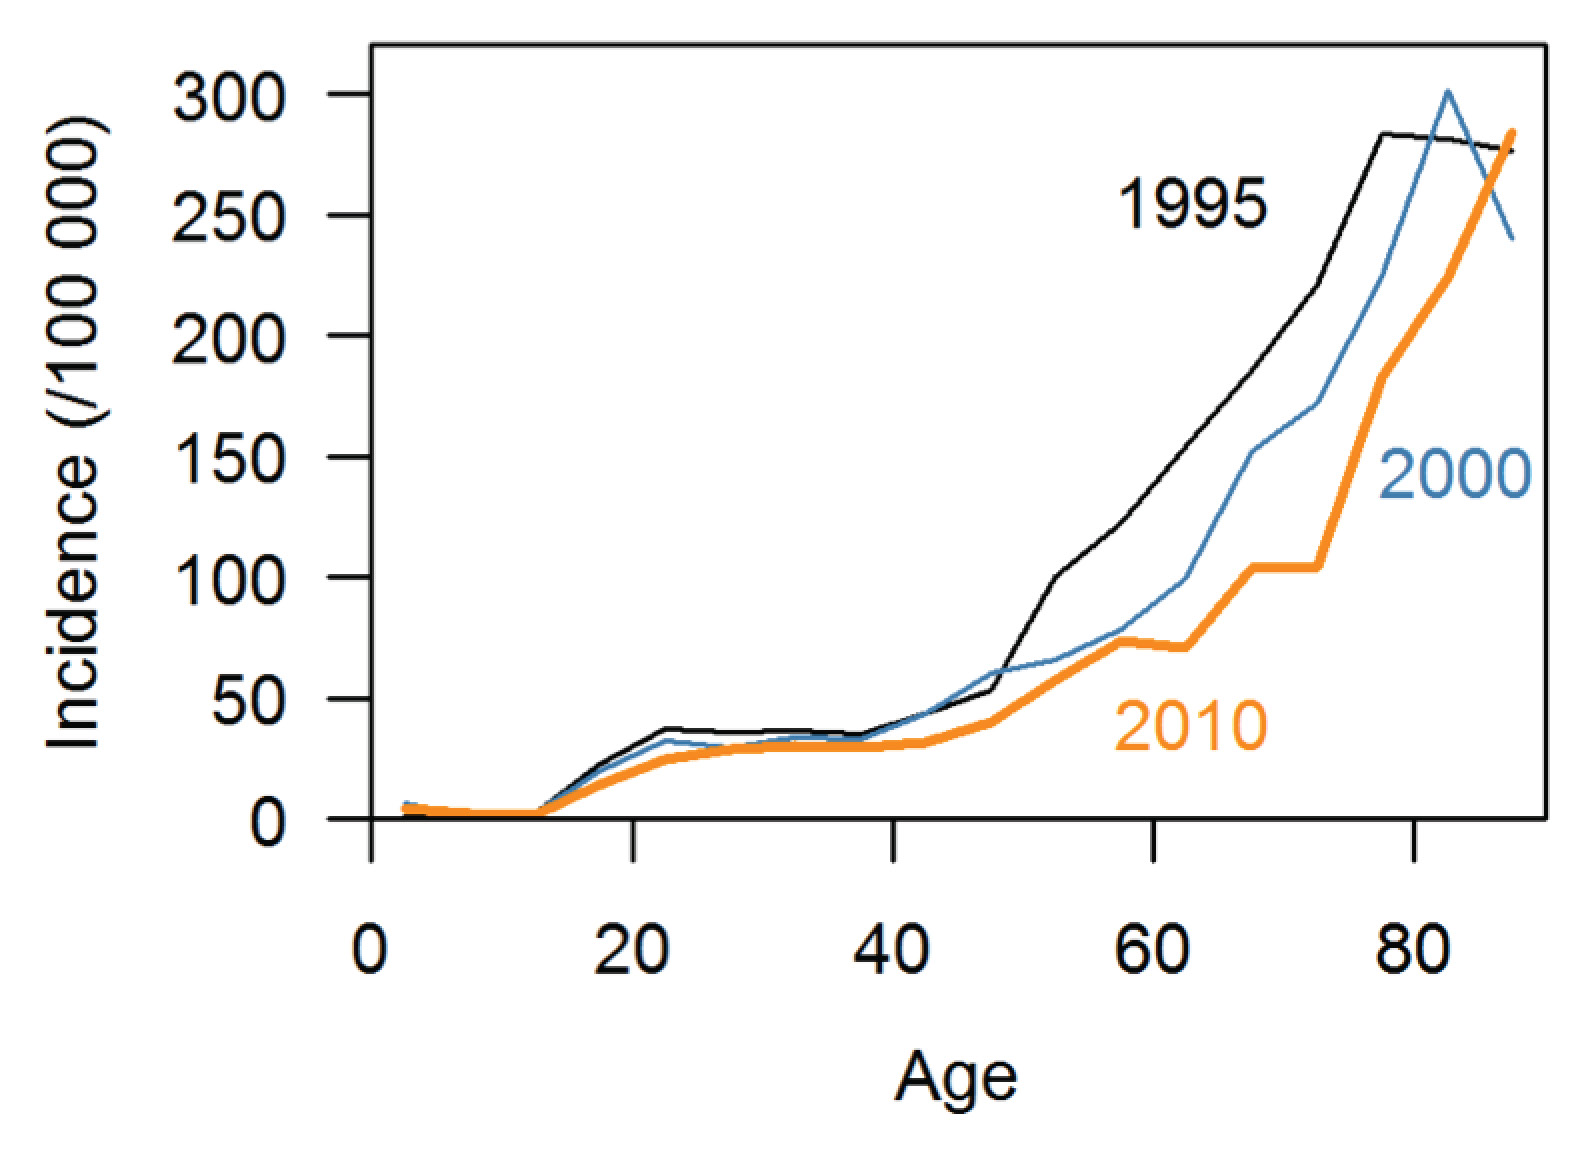
TB incidence by age in Singapore (chart by Dr Alex Cook of SSHSPH)
Age-for-age, TB incidence in Singapore had fallen between 1995 and 2010. Because of the ageing population in Singapore, i.e. relatively more people at the upper end of the two age bands (15-64 years; >65 years), this effect in the fall of incidence in TB was not seen but appeared to have reversed – an example of Simpson’s paradox!
It is true however that the foreign (non-resident) population of Singapore had increased significantly over this time period (1995-2011), and had contributed a greater share of the overall TB cases in Singapore over time.
